Contour Plotting
In CurveExpert Pro and GraphExpert Pro
Along with normal 2D plots and 3D plots, CurveExpert Professional and GraphExpert Professional have the ability to create 2D contour plots for datasets with two independent variables.
CurveExpert Professional supports beautifully antialiased 2D filled and unfilled contour plots. The color bar is customizable, with over 130 different color maps to choose from in order to allow you to express your data in the most meaningful way. Examples of contour plots are below.
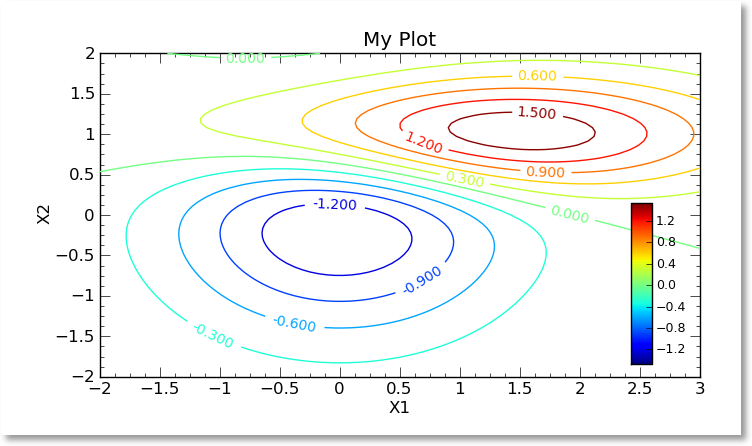
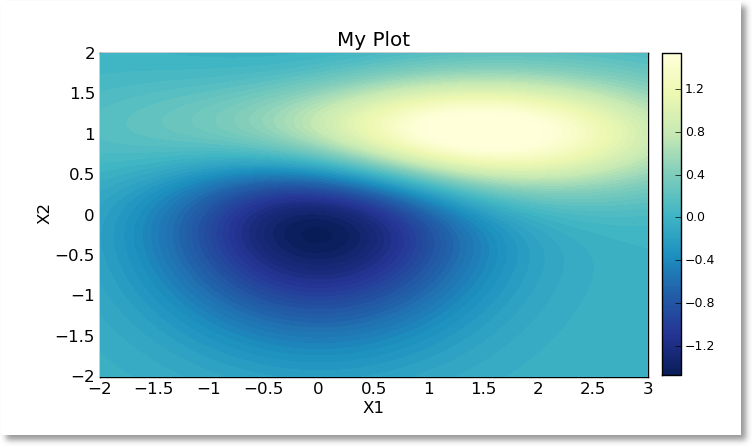
Contour plots are still fully interactive; double clicking the color bar will allow changing its properties, and double clicking the plot itself will allow the setting of plot properties and dataset/series properties. One can freely zoom and pan in a 2D contour plot, just as in a normal (one independent variable) 2D plot. Also, the colorbar can simply be dragged and dropped into position as desired.
In order to find the best tradeoff between render quality and speed, the user can configure the number of levels shown in the contour plot; for example, the second contour plot above has a rather high number of levels (75) in order for it to look like a smooth gradient. Even so, rendering of the entire plot takes less than 0.1 seconds on a Core i7 based computer. Increasing the number of levels to 400 gives a very high quality gradient, with the rendering taking approximately 1 second on the same testbed computer.
Contour labels, if desired, are very nicely and automatically drawn as a part of a contour line’s arc.