Bringing graphs to life with annotations and images; CurveExpert Pro 1.5.0 released
Version 1.5.0 of CurveExpert Professional has been released, and the main feature addition is the ability to place images on a graph in a fully interactive manner. (note that this article only discusses the changes between 1.3.0 and 1.5.0. For a more in-depth look at CurveExpertPro, see What is CurveExpert Professional. )
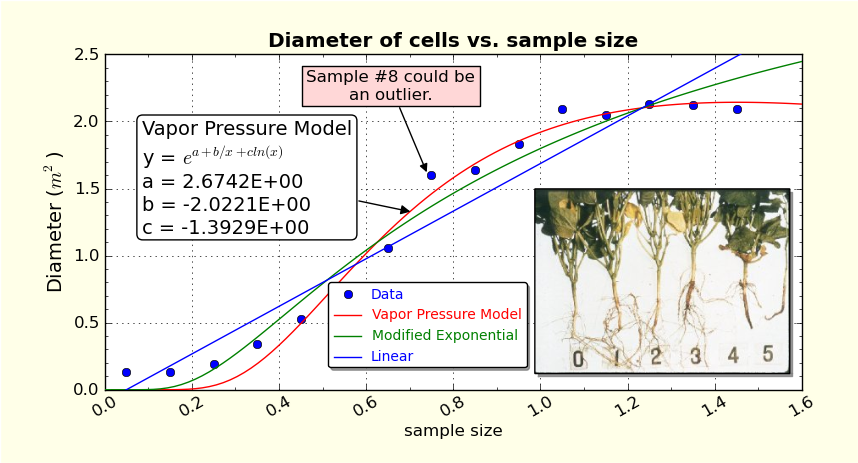
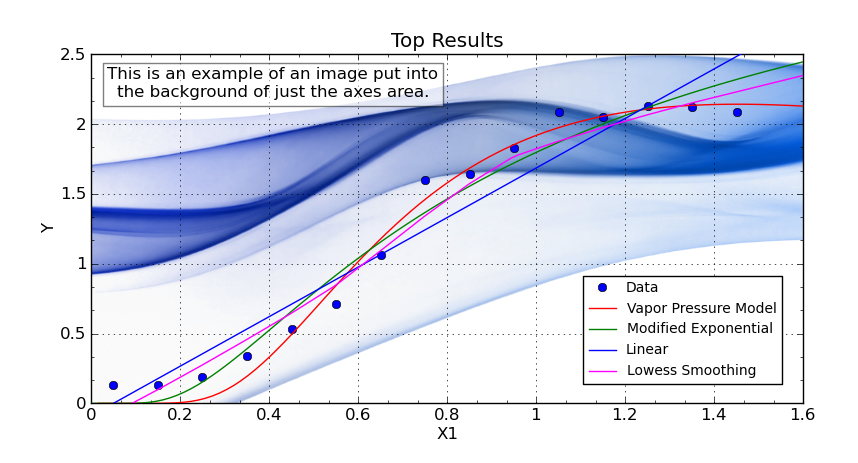
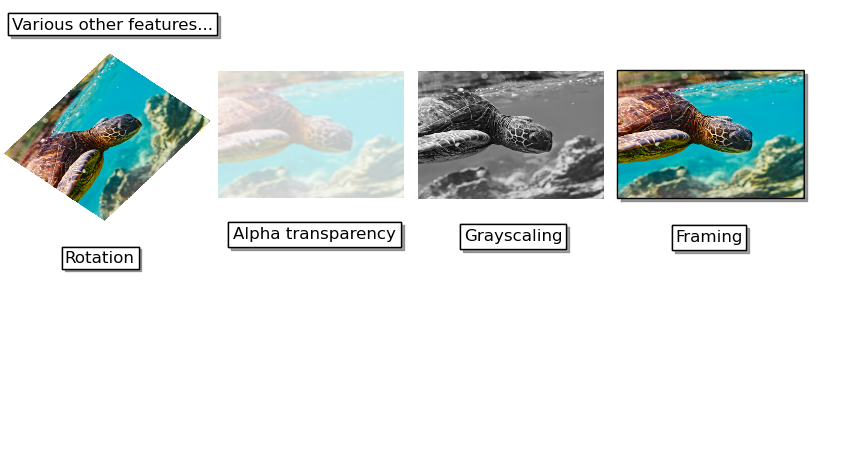
In this release, the ability to add images to your graphs has been added; this capability is very powerful and can allow to you to convey a great deal more information in a single graph. Images can be added by picking an image file, drag and drop, or pasting from the clipboard. Interacting with the image is performed in a standard manner, much like Powerpoint(TM) presentation. Once the image is placed on the graph canvas, quite a few operations can be performed, such as image processing (sharpening, smoothing, embossing, etc.), rotating, grayscaling, and adding transparency (selectively if needed). Also, the image can be placed behind the graph elements, filling the entire axes area or graph canvas area as need be. If your image already has a transparency channel, it is respected.
Some samples of graphs using the image features are shown below, and a sample file “image_demo.cxp” is included with the software, which demonstrates the various ways images can be used.
In addition to the new ability to add images, many new interactivity features for the graph have been added. Hovering the mouse over any graph element and pressing ‘x’, or double clicking, opens the appropriate properties dialog for that graph element. This allows you to quickly configure a graph to obtain the look that you desire. Further, the graph title can now be moved directly via a drag and drop operation, so that you can position the graph title anywhere that you desire on the graph canvas. Cut/Copy/Paste/Clear now work appropriately on the graph element under the cursor, and further, the cursor changes dynamically in order to indicate whether or not that particular element is moveable via a drag and drop. The best way to become acquainted with these new graph interactivity features is to open a sample CurveExpert Professional file and just experiment with these new time-saving capabilities.
The official change log from 1.3.0 to 1.5.0 is below:
- ADDED: Images can be placed on graphs, or used as backgrounds for the entire figure or just the graph area. See the new image_demo.cxp file.
- ADDED: Redesigned graph interactivity
- can directly move graph title into the desired location with drag and drop
- double click (or press x) on graph title opens properties for the title
- double click (or press x) on axis label lets you set the text
- double click (or press x) on axis opens the graph properties dialog for that axis
- double click (or press x) on legend opens legend properties
- double click (or press x) on image opens image properties
- double click (or press x) on annotation opens annotation properties
- double click (or press x) on a colorbar opens colorbar properties
- double click (or press x) anywhere else on the graph opens the graph properties
- shift click (or press r) on the graph to resize the entire frame and/or move it interactively
- colorbar can now be resized dynamically (as well as moved)
- Ctrl+C/Ctrl+V/Ctrl+X/Del (cut/copy/paste/clear) now work appropriately on the item under the cursor
- mouse cursor always appropriately changes in order to indicate operations that can be done to the item under the cursor
- ADDED: graph can be set as padded (default) or nonpadded, which allows fine control over exactly where the graph frame locations are, at the expense of possibly clipping the text surrounding the plot.
- ADDED: the graph title position can now be set arbitrarily
- CHANGED: cxp file storage scheme improved; saved files should all be noticeably smaller, and read noticeably faster.
- CHANGED: Could not have a standard deviation column added directly via the File->New dialog. Added.
- CHANGED: mouse cursor now indicates which objects on a graph are moveable, and is context sensitive when pointing to a result.
- CHANGED: When saving a graph theme directly from the graph, the dialog has been slightly redesigned so that existing themes can be seen, and an overwrite warning is issued if attempting to overwriting an existing theme.
- CHANGED: Windows version no longer dependent on MSCVRT100.dll
- RESOLVED: Scientific, Fixed point, and Engineering formatting did not work for colorbars. Fixed.
- RESOLVED: in the Legend Dialog (new dialog introduced in 1.3.0), the legend location was always flipped to “specified location” regardless of the actual placement strategy. Fixed.
- RESOLVED: If autoguessing off, a warning dialog would appear even in the Function selection dialog, if more than 3 functions selected. Fixed.
- RESOLVED: able to set minval > maxval in the colorbar mapping dialog. Fixed.
- RESOLVED: Shift+right arrow would let the “+” tab be exposed in the results and graphs notebook. Fixed.
- RESOLVED: after printing, the legend box could grow very large temporarily.
- RESOLVED: (Linux only) dragging a legend on a 3D plot caused the plot to rotate disconcertingly. Fixed.
- RESOLVED: in esoteric situations, the advanced user model validation would fail on a correct model. Fixed.
- RESOLVED: right click menu in the advanced model editor did not properly display the Paste and Delete items. Fixed.