CurveExpert Professional adds contour plotting in 1.1.0
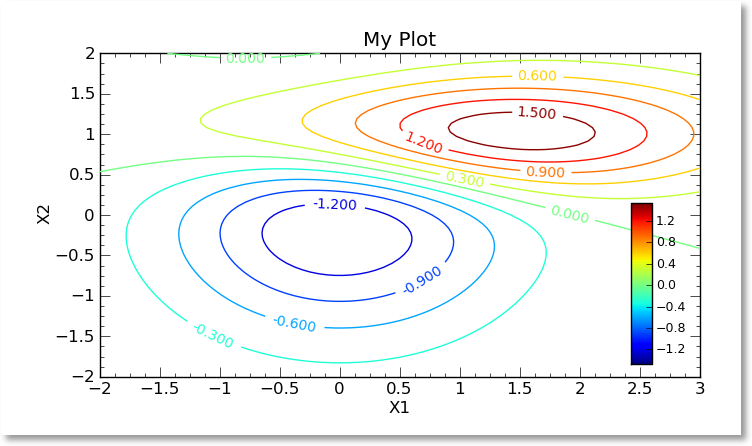
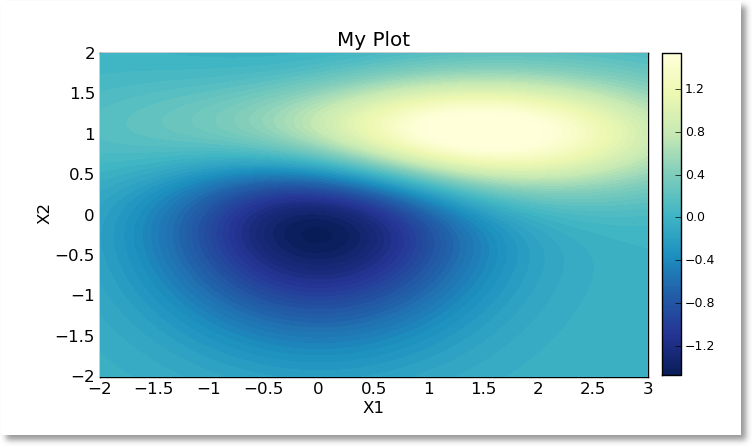
Version 1.1.0 of CurveExpert Professional has been released, and the main feature addition is the ability to create 2D contour plots for datasets with two independent variables. An example of this can be seen below…
(note that this article only discusses the changes between 1.0.2 and 1.1.0. For a more in-depth look at CurveExpertPro, see What is CurveExpert Professional. )
Also, several other useful workflow improvements have been added, such as the ability to clone a graph (create an exact copy), the ability to insert rows in the data spreadsheet, and the user can now format the numbers in the spreadsheet as desired. The custom models tool has been redesigned so that the simple and advanced models can be edited via the same window. There are also a list of bugs that have been addressed in this release.
The official change log from 1.0.2 to 1.1.0 is below:
- ADDED: 2D Contour plotting.
- ADDED: ability to clone a graph
- ADDED: ability to insert rows in spreadsheet
- ADDED: ability to copy statistics info from the Data Statistics dialog
- ADDED: appropriate credits to About box
- ADDED: logical functions for use in the custom models and functions
- ADDED: video tutorials now integrated with manual
- ADDED: formatting for data in spreadsheet can now be set through the app preferences
- CHANGED: various graph drawing quality improvements
- CHANGED: Custom Models/Functions dialog has been redesigned, so that there is no longer a need for separate Simple/Advanced dialogs.
- CHANGED: legend dragging is now much faster
- CHANGED: Delayed autoscale when the user is entering data; this lets the data entry process go faster.
- CHANGED: main toolbar can now be hidden
- CHANGED: robustness added to NIST tests, so that they fail and report properly if the necessary files are not present.
- CHANGED: In OSX, font size on notification popups too small. Enlarged.
- CHANGED: new colormap picker in the 3D plotting properties dialog.
- RESOLVED: X/Y axis minor grid being drawn over the major grid.
- RESOLVED: pasting data in invalid areas sometimes caused strange behavior in the spreadsheet.
- RESOLVED: variable names such as “xmine” were not parsed properly when creating models.
- RESOLVED: graph on the Initial Guess Dialog did not resize properly.
- RESOLVED: create new file from clipboard; if the current file was modified, there was no asking to save the modified file before importing data from clipboard
- RESOLVED: the “document modified” flag did not get set when a graph was added/deleted or a result added to a graph
- RESOLVED: no Ctrl+S available to save a document. Fixed.
- RESOLVED: better handling of a model in a error state via the new Custom Model dialog.
- RESOLVED: data marker fill and edge color were not restored from graph theme. Fixed.
- RESOLVED: while legend is being dragged, the motion tracker should be turned off. Fixed.
- RESOLVED: graphs read from cxp files could not have results added to them via drag/drop. Fixed.